A staggered-entry reconstruction of MPLY's current holdings turned $10,000 into $171,578. The result is striking, but it is not the fund's record.
Key Takeaways
- The reconstruction was powerful, but it was not the fund’s record. A staggered-entry reconstruction of MPLY’s current holdings grew $10,000 to $171,578 from August 16, 2016 through August 14, 2026. That was a 33.0% annualized return versus 14.9% for SPY.
- The fee did not erase the historical result. The model applied MPLY’s 0.8% annual expense ratio and estimated $14,145 of fee drag across the window. Future returns may not resemble the reconstruction.
- The ride was severe. Maximum drawdown reached −36.8%, and the reconstructed book lost 36.0% during the defined 2022 bear window.
- The method matters as much as the headline. All 100 requested holdings had data, but later-history names entered only after their first available trade. A separate veterans-only sensitivity test left the full reconstruction 23.1% higher.
- The portfolio job is narrow. The evidence fits an aggressive growth satellite better than an income sleeve or a set-and-forget core.
My view: instead of starting with “best ETFs to buy now,” start with a more useful question—what job is the fund supposed to do?
MPLY is a young ETF organized around companies with market control, and its reconstructed history shows exceptional compounding alongside drawdowns large enough to break an investor’s plan. The useful conclusion isn’t that the backcast will repeat. It is that the portfolio has a distinct role, a demanding risk profile, and a method that needs to be read before the return number.
I reconstructed the fund’s current holdings with first-trade entry: each name joined at the first monthly rebalance after its first available trade, and target weights were normalized among names live in that period.
Ten Years of Monopoly, With the Method Visible
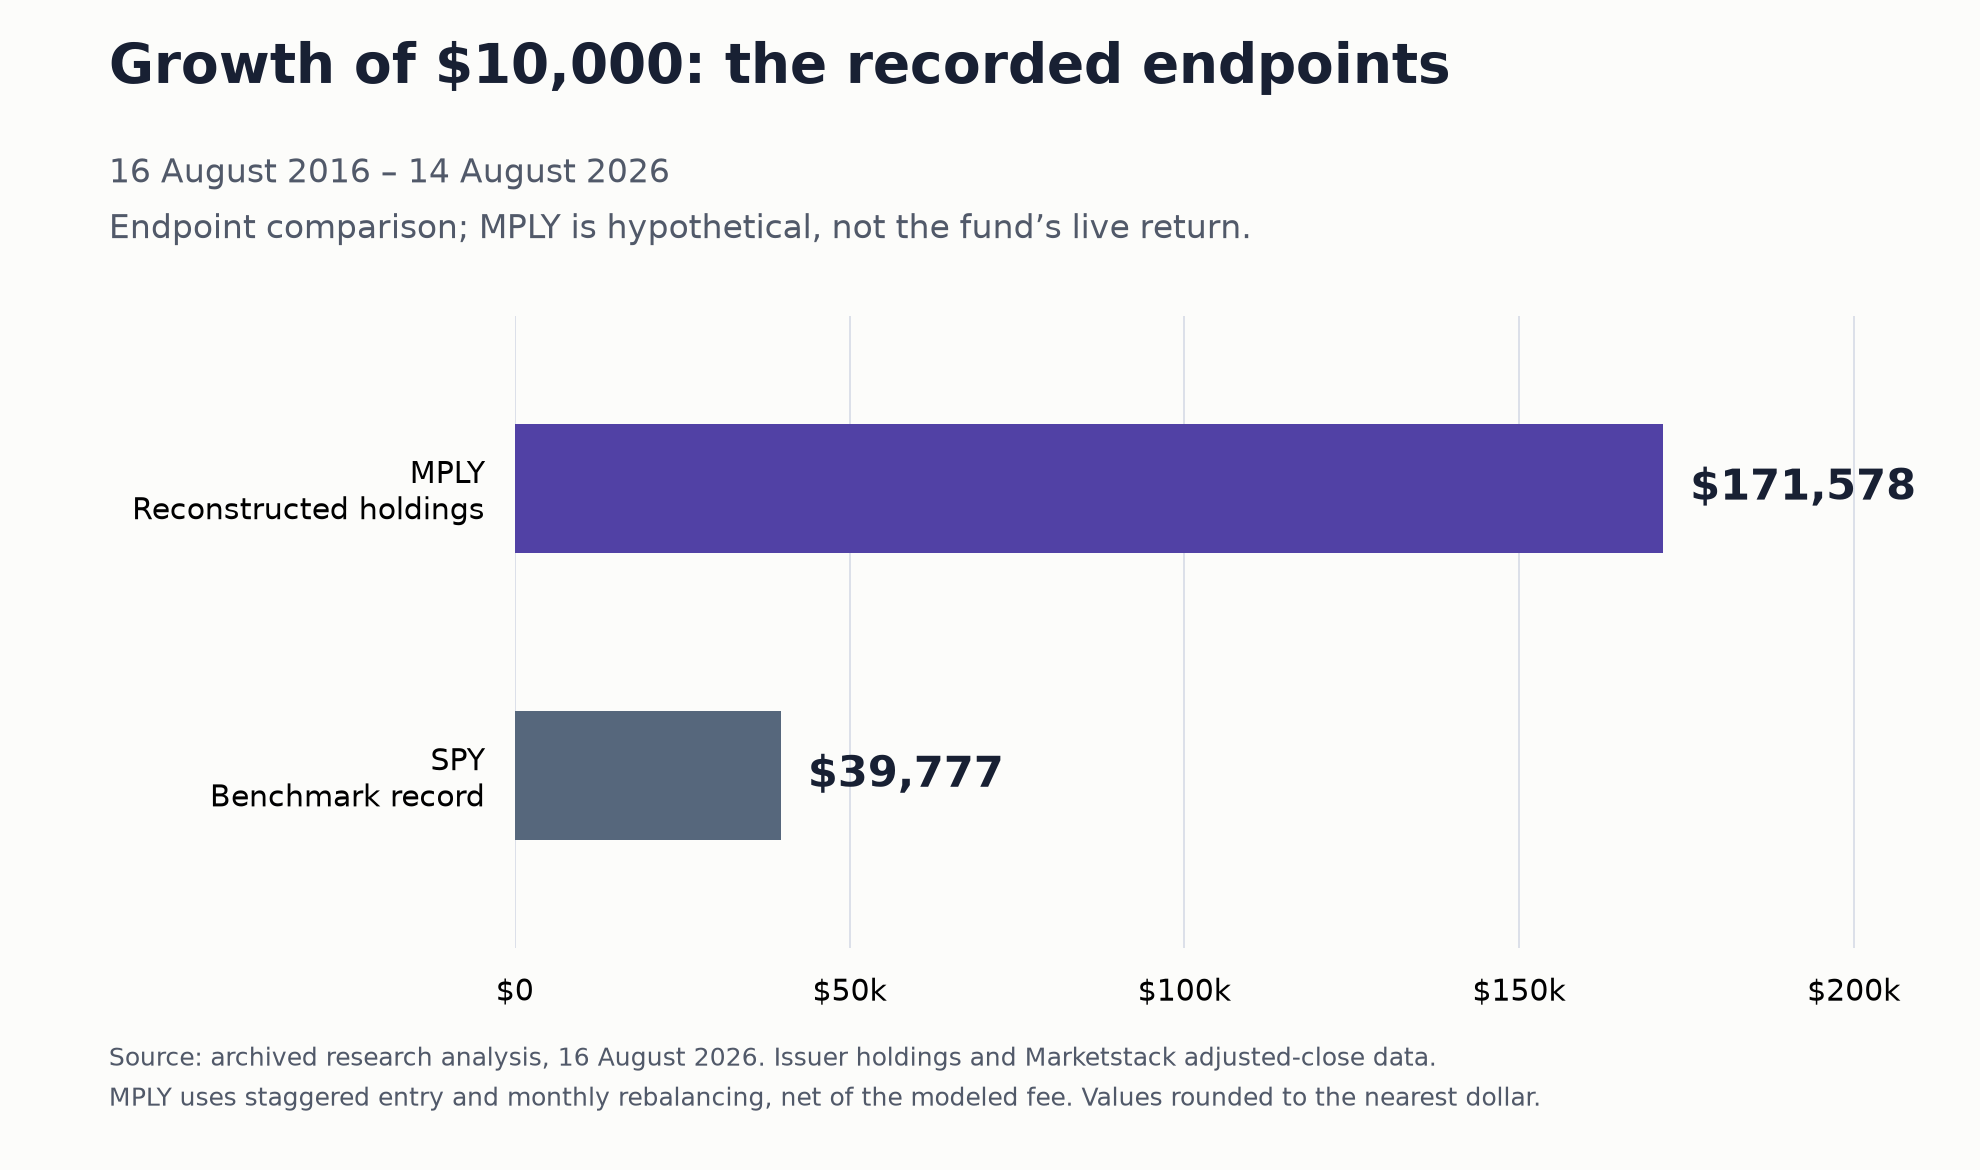
The reconstructed value reached $171,578 while SPY’s live record reached $39,777 over the same observed window, corresponding to annualized returns of 33.0% and 14.9%, respectively.
That is the headline, but it isn’t an exact-basket decade. The construction started with names that had price history and admitted later names at their first eligible monthly rebalance. At the opening reconstructed return date, the names then live represented 93.5% of today’s portfolio weight. The run ultimately had data for all 100 requested holdings and covered 99.7% of current weight.
The consistency statistics in the stored run are still notable: the reconstruction beat SPY in 90.4% of 2,258 rolling one-year windows during the measured period, while its best single month returned 24.2%.
What MPLY Holds
The holdings snapshot contains 100 positions, with the top 10 accounting for 63.3% of the portfolio, the Magnificent Seven group accounting for 49.8%, and the raw Herfindahl-Hirschman concentration statistic at 0.0502.
Author’s clarification: I use that statistic only as a portfolio concentration measure, not as a legal classification or an antitrust claim. The simpler reading is enough: a long tail exists, but roughly half of the current weight sits in the Magnificent Seven group.
The fund’s stated theme is market control. That makes the portfolio a deliberate thesis rather than a neutral cross-section of the market. Whether that thesis keeps paying is unknown; the artifact can describe the historical reconstruction, not settle the future mechanism.
The most recent full-overlap attribution window ran from July 2, 2026 through August 14, 2026, when the reconstructed book returned 4.5%. Microsoft contributed 2.3 percentage points, Nvidia 1.5, and Amazon 0.6. Tesla detracted 0.5 point and Alphabet detracted 0.4. In that short window, a small set of large positions drove much of the result.
The Bull-Market Genius Test
Anyone can look composed while prices rise—the harder test is whether the strategy can stay inside an investor’s risk budget when the market falls.
MPLY’s reconstructed book would have made that test uncomfortable. The defined 2022 bear window returned −36.0%. The full peak-to-trough decline ran from December 27, 2021 through October 14, 2022, and maximum drawdown reached −36.8%. April 2022 returned −13.6%, September 2022 returned −11.0%, the defined COVID crash window returned −29.7%, and May 2019 returned −10.2%.
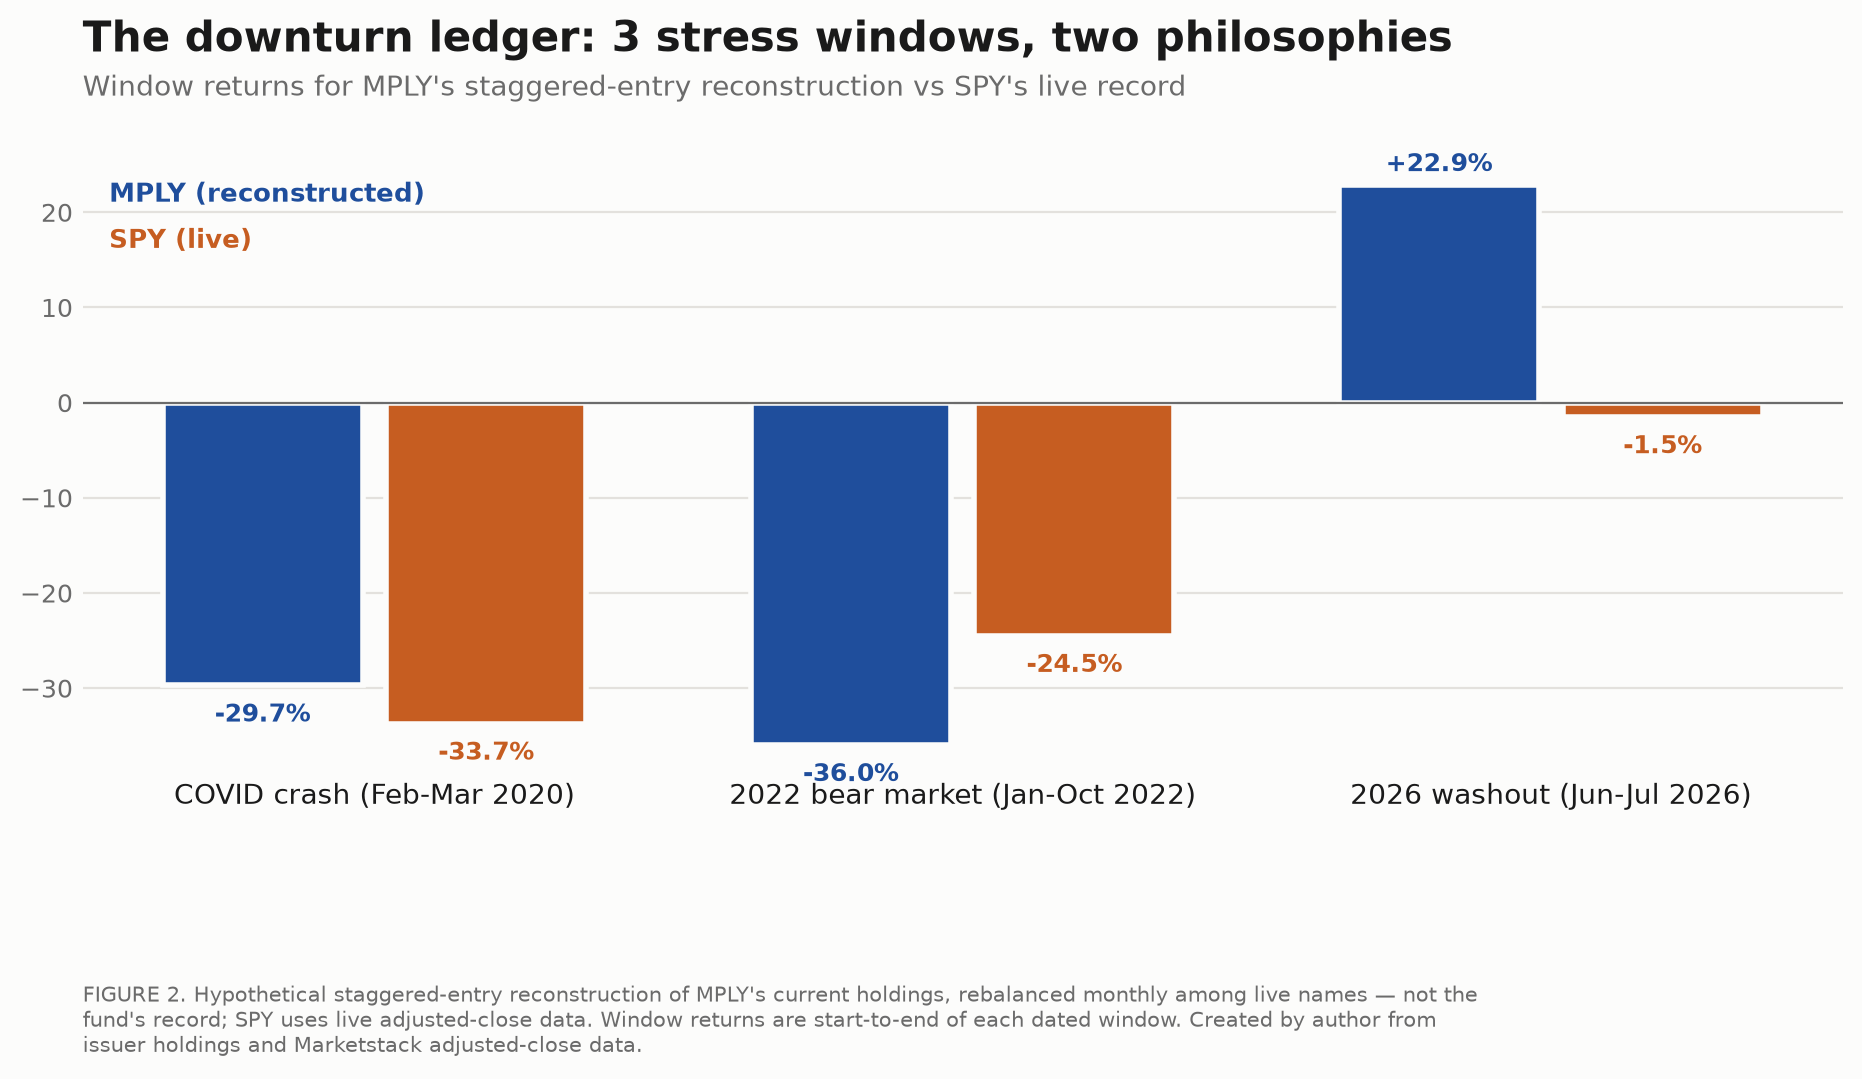
The defined 2026 washout window went the other way and returned 22.9%. Across the full reconstruction, annualized volatility was 24.9%, beta versus SPY was 1.22, and the up/down capture ratios were 1.36 and 1.22. The Sharpe ratio was 1.30.
Those figures describe a portfolio that amplified the benchmark in both directions during the measured sample. The upside capture exceeded the downside capture, but that doesn’t cancel the drawdown; an investor who cannot tolerate a loss near one-third should not treat the long-run ending value as the only relevant result.
Backcast vs. Reality
MPLY launched on May 16, 2025, so its live record is much shorter than the reconstructed window; across the 264 overlapping trading days in the run, the live fund returned 26.9% while the reconstruction returned 81.6%.
The weekly correlation between those two records was 0.96. That supports the narrower observation that the live fund and reconstructed book moved similarly during their overlap. It does not turn the reconstruction into the fund’s history, and it does not explain away the large return gap.
The veterans-only sensitivity test is another guardrail: it excluded eight holdings representing 6.4% of current weight, and the full staggered-entry reconstruction finished 23.1% above the veterans-only version.
The fee deserves the same discipline. The model deducted the 0.8% annual expense ratio, and the reconstruction still finished far ahead of SPY. That tells us the historical result survived the modeled fee. It does not prove that paying the fee will be rewarded in the future.
What Job Can MPLY Do?
Income: This isn’t the natural fit. The live fund had paid one distribution totaling $0.039 per share, equal to a 0.1% yield on the last close in the run. Investors seeking a material cash-income stream need a different evidence set and likely a different product.
Core holding: The concentration and drawdown record make this a demanding core candidate. A portfolio with 63.3% in its top 10 and a reconstructed maximum drawdown of −36.8% asks the owner to accept a great deal of thesis and path risk.
Aggressive growth satellite: This is the clearest role supported by the evidence. A satellite can express the market-control thesis without asking it to carry every portfolio job. Sizing, time horizon, tax circumstances, and the ability to hold through a deep decline remain investor-specific decisions.
The frozen fund facts listed $16.7 million in assets. General trading guidance, not a finding from this run: check current spreads, volume, premiums or discounts, and limit-order execution before placing an ETF order.
The Bottom Line
MPLY’s current-holdings reconstruction produced an extraordinary historical result. It also produced a drawdown near one-third, a large live-versus-backcast gap, and a material gap in the veterans-only sensitivity test. Read together, those facts support a narrow verdict: this is a thesis-driven growth satellite, not a substitute for every portfolio function.
The fund may suit an investor who already has a diversified core, wants a separate market-control thesis, and can tolerate severe drawdowns without turning a temporary loss into a permanent one; it does not fit an investor seeking income, low volatility, or a decade of actual fund performance.
The reconstruction and the fund are related but not interchangeable: one is a controlled historical exercise using today’s holdings and explicit entry rules, while the other is the product an investor can actually own from here.
· · ·
FAQ
Which ETF is best to invest in currently?
My view is that there is no universal answer. Start with the missing portfolio job, then compare products on cost, diversification, liquidity, risk, and evidence relevant to that job. MPLY’s run supports consideration as an aggressive growth satellite. It does not establish MPLY as the best choice for every investor.
What three ETFs should I invest in?
My preferred framework uses three roles: a diversified core, a deliberate return-seeking satellite, and ballast for bad markets. The actual funds and weights depend on horizon, taxes, liquidity needs, existing holdings, and tolerance for loss.
What is the best value ETF to buy right now?
This run cannot answer that question because it did not compare value ETFs. It analyzed MPLY’s current holdings, reconstructed risk and return, and compared the result with SPY. My decision framework for a value fund would examine its current holdings, costs, valuation method, overlap, and live trading evidence.
What are the top five ETFs to buy?
No fixed top five works for every portfolio. Define the required jobs first, eliminate funds that duplicate existing exposures, and compare the remaining candidates using current evidence. Rankings without a portfolio context can confuse recent performance with suitability.
Methodology & data: The run requested 100 current MPLY holdings and found price data for all 100, representing 99.7% of current weight. The staggered-entry construction covers August 16, 2016 through August 14, 2026, deducts the fund’s 0.8% annual expense ratio, and compares with SPY over the same observed dates. Each holding enters at the first monthly rebalance after its first available trade; target weights are normalized among names live in each period. At the opening reconstructed return date, live names represented 93.5% of current weight. This is not an exact-basket decade and not the fund’s record. A veterans-only sensitivity test excluded eight holdings representing 6.4% of current weight; the full reconstruction finished 23.1% above that veterans-only version. Live-versus-backcast statistics cover 264 overlapping trading days. Distribution figures come from MPLY’s live record. Drawdown, volatility, capture, attribution, and rolling-window figures refer to the reconstruction unless stated otherwise. Disclaimer: nothing here is a recommendation; suitability depends on personal goals, horizon, finances, and risk tolerance.
Sources & evidence
- Strategy Shares: MPLY issuer information and fund documents. The research used a frozen August 2026 snapshot; this live page may have changed.
- Marketstack data documentation. The analysis used stored adjusted-close observations; this link describes the provider, not a public copy of the underlying dataset.
The published comparison uses the stored research run dated 16 August 2026. Read our approach to reconstructions or request clarification of a source or calculation.