Two funds, one moat thesis: MPLY’s current book would have turned $10,000 into $173,899 over the past decade — value-screened MOAT’s live record made $33,967.
Key Takeaways
- Monopoly purity won the decade. Rebuilt holding-by-holding and net of fees, MPLY’s current portfolio would have turned $10,000 into $173,899 — a 33.0% CAGR. The S&P 500 managed $39,699 (14.8%).
- The value screen was the drag. MOAT’s live record over the same window made $33,967, a 13.1% CAGR — trailing even the plain index.
- You’d have paid for the ride. The reconstructed book’s worst peak-to-trough measured −36.8% versus MOAT’s −33.3%, on 24.9% annualized volatility.
- MPLY is the pricey fund. A 0.8% expense ratio would have skimmed $14,319 across the decade — and the reconstructed returns above are already net of it.
- Backcasts flatter by construction. Hindsight and survivorship inflate the reconstruction by a measured 22.7%.
· · ·
The MPLY ETF and the VanEck Morningstar Wide Moat ETF (MOAT) sell the same dream: a portfolio of companies so dominant that competitors can’t touch them.
The difference is the filter. MPLY buys market control wherever it finds it, at whatever multiple the market demands. MOAT refuses to pay up — every holding must trade below Morningstar’s estimate of fair value.
One thesis, two very different machines. So which philosophy actually serves the investor — control at any price, or control on sale? The short answer from a decade of data: the cheapness filter was the drag, not the discipline.
I rebuilt MPLY’s current portfolio holding-by-holding, backcast it across the past decade net of fees, and ran MOAT’s live record alongside it.
Two Machines for the Same Thesis
Strip both funds to their blueprints and the disagreement is one line long: what role should price play in buying dominance?
MPLY’s answer is none. The reconstructed book holds 100 positions, but the top ten carry 63.3% of the weight, and the “Magnificent Seven” platforms alone account for 49.8%. Its Herfindahl-Hirschman Index — a standard concentration gauge where 1.0 is a single stock and lower means more spread out — sits at 0.0502, high for a 100-name fund. This is what a control screen buys when it doesn’t apologize for multiples.
The best companies do not compete. They control.
MOAT’s answer is price first. It holds only companies Morningstar rates as wide-moat, and among those, only the ones trading furthest below the analysts’ fair-value estimates. That discipline sounds like an upgrade on MPLY’s purity. Mechanically, it’s a filter that ejects the best names.
Here’s why. A conservative fair-value model is anchored on the cash a business generates today. The market prices the strongest monopolies on how long they can keep generating it. Those two numbers rarely agree — so the strongest controllers almost never screen cheap, and a price-first moat fund systematically fills its book with the second tier: decent moats at a discount.
I’m no fan of value investing, and this is why. A low valuation is never a bargain on its own — more often, it’s the market’s verdict on durability. If this mechanism is right, MOAT should have persistently underowned the decade’s biggest winners.
The decade is the test.
The Decade in 2,255 Windows
Figure 1 plots the full window, and the visual gap is the article’s whole argument. One fund’s philosophy compounded. The other’s filtered it away.
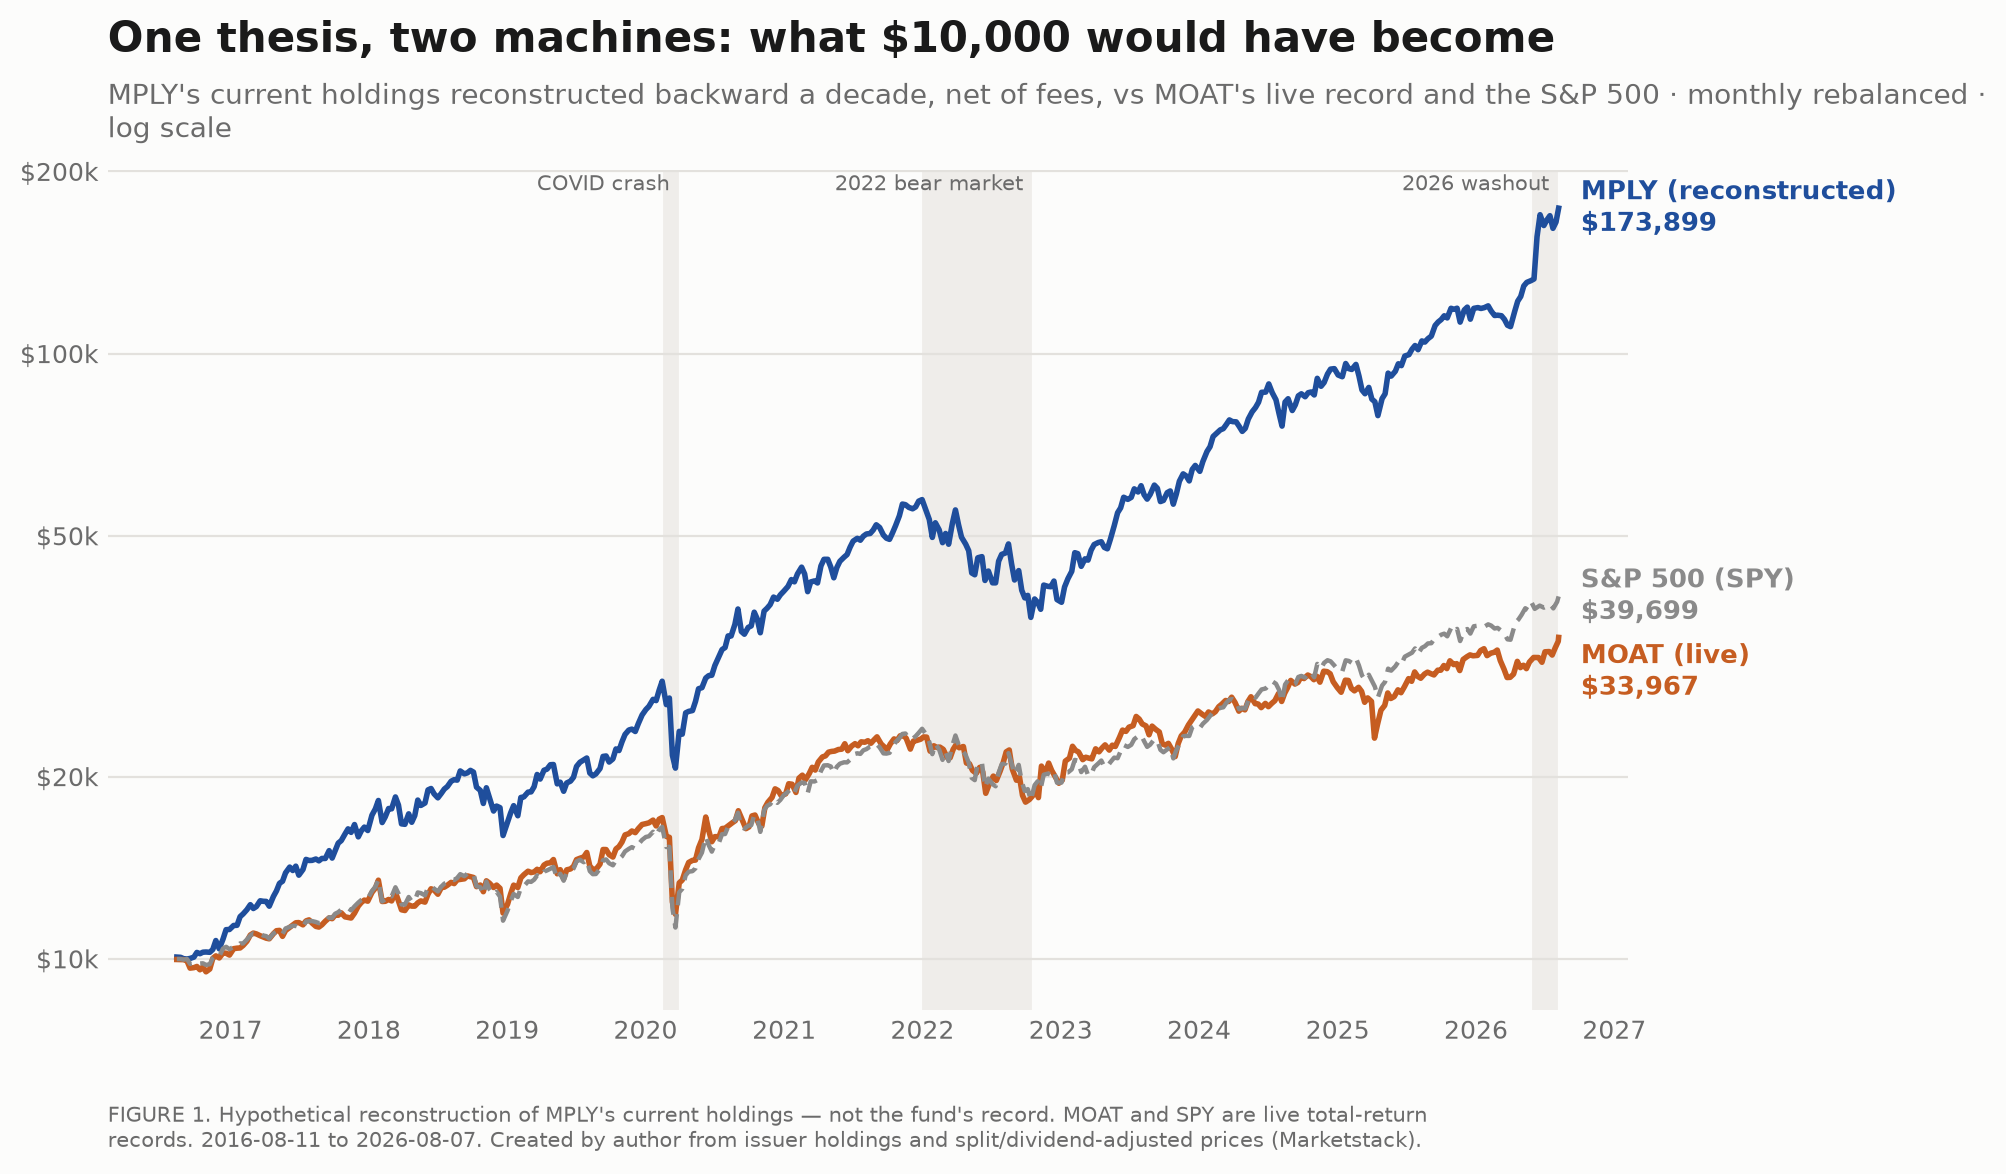
Persistence — Winner: MPLY. Loser: MOAT. One endpoint can be luck, so I checked every rolling one-year window in the decade: 2,255 of them. The reconstructed book beat the S&P 500 in 90.4% — with an asterisk, since the rolling data pits the reconstruction against the index rather than against MOAT’s daily tape. Its best single month was +24.2%. Even risk-adjusted the picture holds: a Sharpe ratio of 1.31 — return earned per unit of risk taken — is strong for a book this concentrated.
And the engine is exactly who the mechanism predicts. Over the most recent full-overlap window (July 2 → August 7, 2026), the reconstructed book gained +4.8%. Microsoft contributed 2.3 percentage points of that, NVIDIA 1.4, Amazon 0.9, Broadcom 0.7, while Tesla subtracted 0.6.
A handful of controllers does the lifting — the same names a fair-value screen keeps sidelining.
The Downturn Ledger
Anyone can be a genius in a bull market. Downturns are the audit.
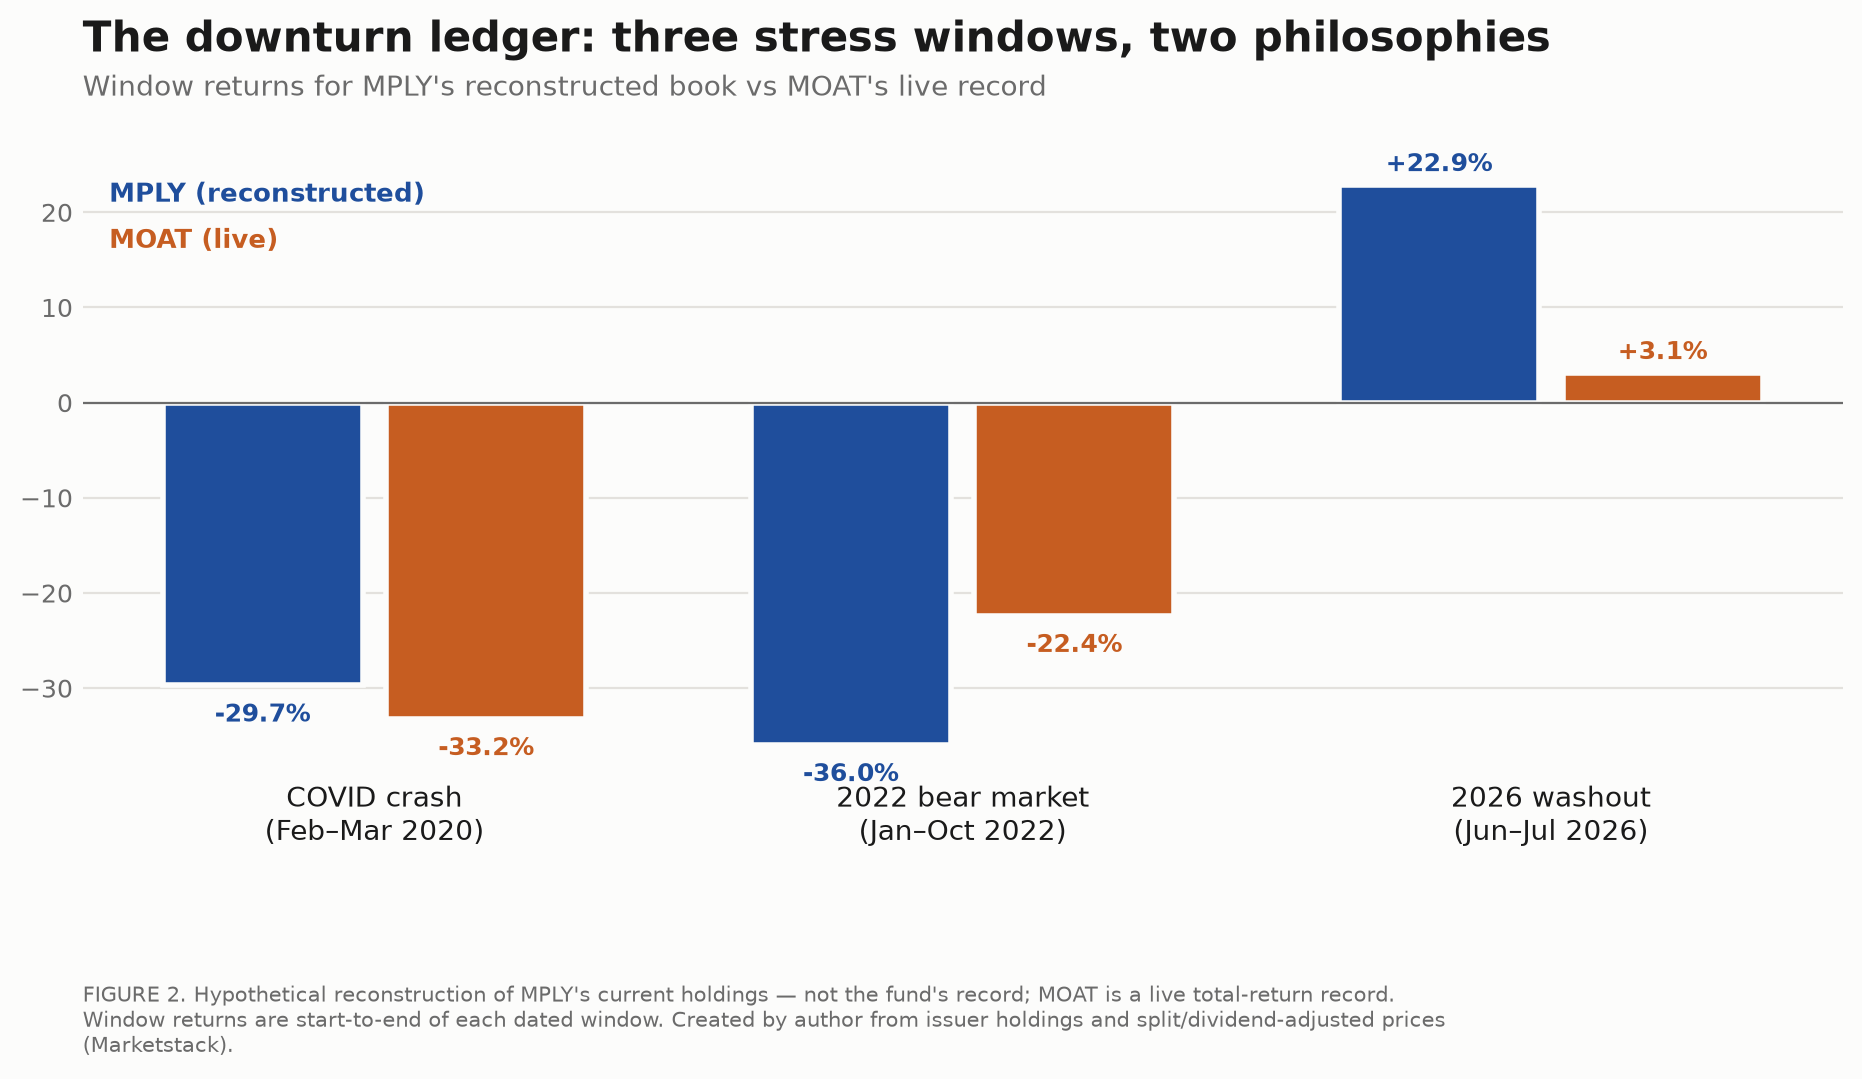
Give the value screen its due first. In the COVID crash the reconstructed book fell −29.7%. Then came 2022.
Crash of 2022 — Winner: MOAT. Loser: MPLY. The reconstructed book fell −36.0% through the bear market while MOAT’s live portfolio lost −22.4%. That’s the value filter earning its keep: cheaper names had less altitude when rates repriced long-duration growth stocks, and a book with a beta of 1.22 — it tends to move about 22% further than the index on a given day — falls harder by design.
The monthly ledger is as ugly as the headline. The book’s three worst months were April 2022 (−13.6%), September 2022 (−11.0%), and May 2019 (−10.2%).
Still, one cushioned crash is not a decade. The reconstructed book captured 136% of the benchmark’s up moves against 122% of its down moves — that asymmetry, compounded, is where the gap in Figure 1 comes from. And diversification may sometimes protect investors in downturns, but that may not necessarily be the case; 2022 is one episode, not a law.
It’s a bumpy ride. The screen earned its keep in exactly one kind of weather.
The Live-Record Check
MPLY launched on May 16, 2025, which makes it too young to judge on its live tape alone — the whole reason for interrogating the holdings instead of the launch hype. But the overlap we do have is instructive.
Across 258 overlapping trading days, the live fund returned +28.3%. The same book, backcast over the identical stretch, returned +83.5%. The weekly correlation between the two: 0.96.
Read that pair of numbers carefully, because the sign of the gap is what carries the information. The 0.96 says the live fund really is the reconstructed book — same animal, same behavior. The return gap says the reconstruction ran far hotter than reality, inflated by a hindsight engine that loaded up on survivors. Through the 2026 washout window alone, the reconstructed book gained +22.9% — the kind of rebound a backcast collects automatically and a live investor collects only by holding on.
So treat the reconstruction as the philosophy’s ceiling, not its promise. That’s the right posture for every backcast, this one included.
So, Is the MPLY ETF Worth Its Fee?
Cost and scale — Winner: MOAT. Loser: MPLY. MOAT charges 0.5% a year; MPLY costs meaningfully more, though its reconstructed margin over MOAT is already net of that fee — and it isn’t a nail-biter. MOAT also runs $12.32 billion and has traded live since April 24, 2012. MPLY holds about $16.7 million, flying under the radar, with the frictions tiny funds carry: thinner trading and the ever-present possibility the issuer folds the fund.
Those frictions are real, and I’ve priced them into the verdicts below rather than waving them away.
Which brings us back to the only question that matters: which philosophy do you hire? The best ETF to buy right now depends on the job each fund is hired to do. Hired for maximum compounding, monopoly purity won the decade and it wasn’t close — net of its fee, in the great majority of rolling windows, with the index beaten as a bystander. Hired for downside manners, the value screen did its job in the one crash that tested it.
The data picked a philosophy. It also priced the insurance.
The Bottom Line
MPLY is best suited for investors who believe market control is the factor worth paying for — and who can hold a young, tiny, high-fee fund through a crash deeper than the index’s, knowing the decade of evidence is a reconstruction, not a lived record.
MOAT is best suited for investors who want moat exposure with a valuation brake: a lower fee, a deep and seasoned live record, and a milder 2022 — and who accept that the same filter which cushioned that crash dragged the decade.
Both funds court the quality-conscious investor, so the overlap needs a referee. If you’re hiring moats for maximum long-horizon compounding, the reconstruction favors MPLY’s purity. If you’re hiring moats as a defensive equity sleeve, MOAT is the better fit for that job.
The tension worth sitting with: the screen’s drag and its cushion are one mechanism. You can’t buy the 2022 protection without paying for it in forgone upside.
· · ·
FAQ
Is the MPLY ETF a good investment?
It depends on the job. MPLY’s reconstructed decade record is far stronger than MOAT’s or the S&P 500’s, but the fund is young, small, and the most expensive in this comparison, with a deeper crash profile. It best suits investors who believe market control is the factor worth paying for and can hold through hard drawdowns.
What is the difference between MPLY and MOAT?
Both funds target companies with dominant market positions. MPLY buys market control at whatever price the market demands. MOAT only buys moat stocks trading below Morningstar’s fair-value estimate. That valuation filter systematically excludes the strongest monopolies, which almost never screen cheap — the central trade-off between the two funds.
Is MOAT a good long-term investment?
MOAT offers wide-moat exposure with a valuation discipline, a low fee, and a long live record — and it cushioned the 2022 crash far better than MPLY’s reconstructed book. Over the past decade, though, that same discipline left it behind the plain S&P 500. It suits investors hiring moats as a defensive quality sleeve.
What is the best ETF to buy now?
For most investors, the sensible default is a low-cost, broad index fund such as VOO or VTI as a portfolio’s core. Thematic funds like MPLY and MOAT are satellites that must justify themselves on top of it. Consider your own goals, time horizon, and risk tolerance before adding either.
· · ·
Methodology & data. MPLY’s figures are a backcast, not a lived record: the fund’s current holdings were mapped back to August 12, 2016 and held at those weights through August 7, 2026, using total return (dividends reinvested) and charging the fund’s expense ratio throughout. A backcast rebuilds today’s portfolio backwards; it is not a backtest of rules the fund actually ran. Current holdings cover 99.7% of portfolio weight; eight names lacking a full decade of trading history (6.4% of weight) were excluded. This construction flatters by design — today’s winners were selected with hindsight, and companies that failed along the way leave no trace. The measured size of that tilt is reported in the Key Takeaways, and the live-versus-backcast overlap reported above frames how large it has been in practice. MOAT’s figures are the fund’s live, traded total-return record — a genuine asymmetry, since a live record has no hindsight engine behind it; the comparison therefore tilts toward the reconstruction, and the verdicts above are written with that tilt in mind. All returns are total return; sources quoting price-only returns understate both funds. Benchmark: SPY. Sources: issuer holdings pages and adjusted price histories. All figures created by the author. Full data room: [DATA ROOM LINK]